Find your edge. Test it, trade it, track your returns.

QuantAscent is a desktop portfolio manager for people who manage their own money and want to invest smarter. Turn your ideas into strategies based on real company financials, backtest them against 13+ years of history, and find out whether they hold up before you put money behind them. Then trade through your own brokerage account and track every position against the market. Every rebalance is previewed and approved by you before any order is sent.

QuantAscent is software you operate. It does not recommend securities, does not manage money, and does not know your financial situation. Every order is yours to review and approve.

Create your free account today, no card needed. When the software releases, come back and sign in to start your 60-day free trial (card required), then $19/mo unless you cancel. Sign up before November 12 and get 50% off your first year.

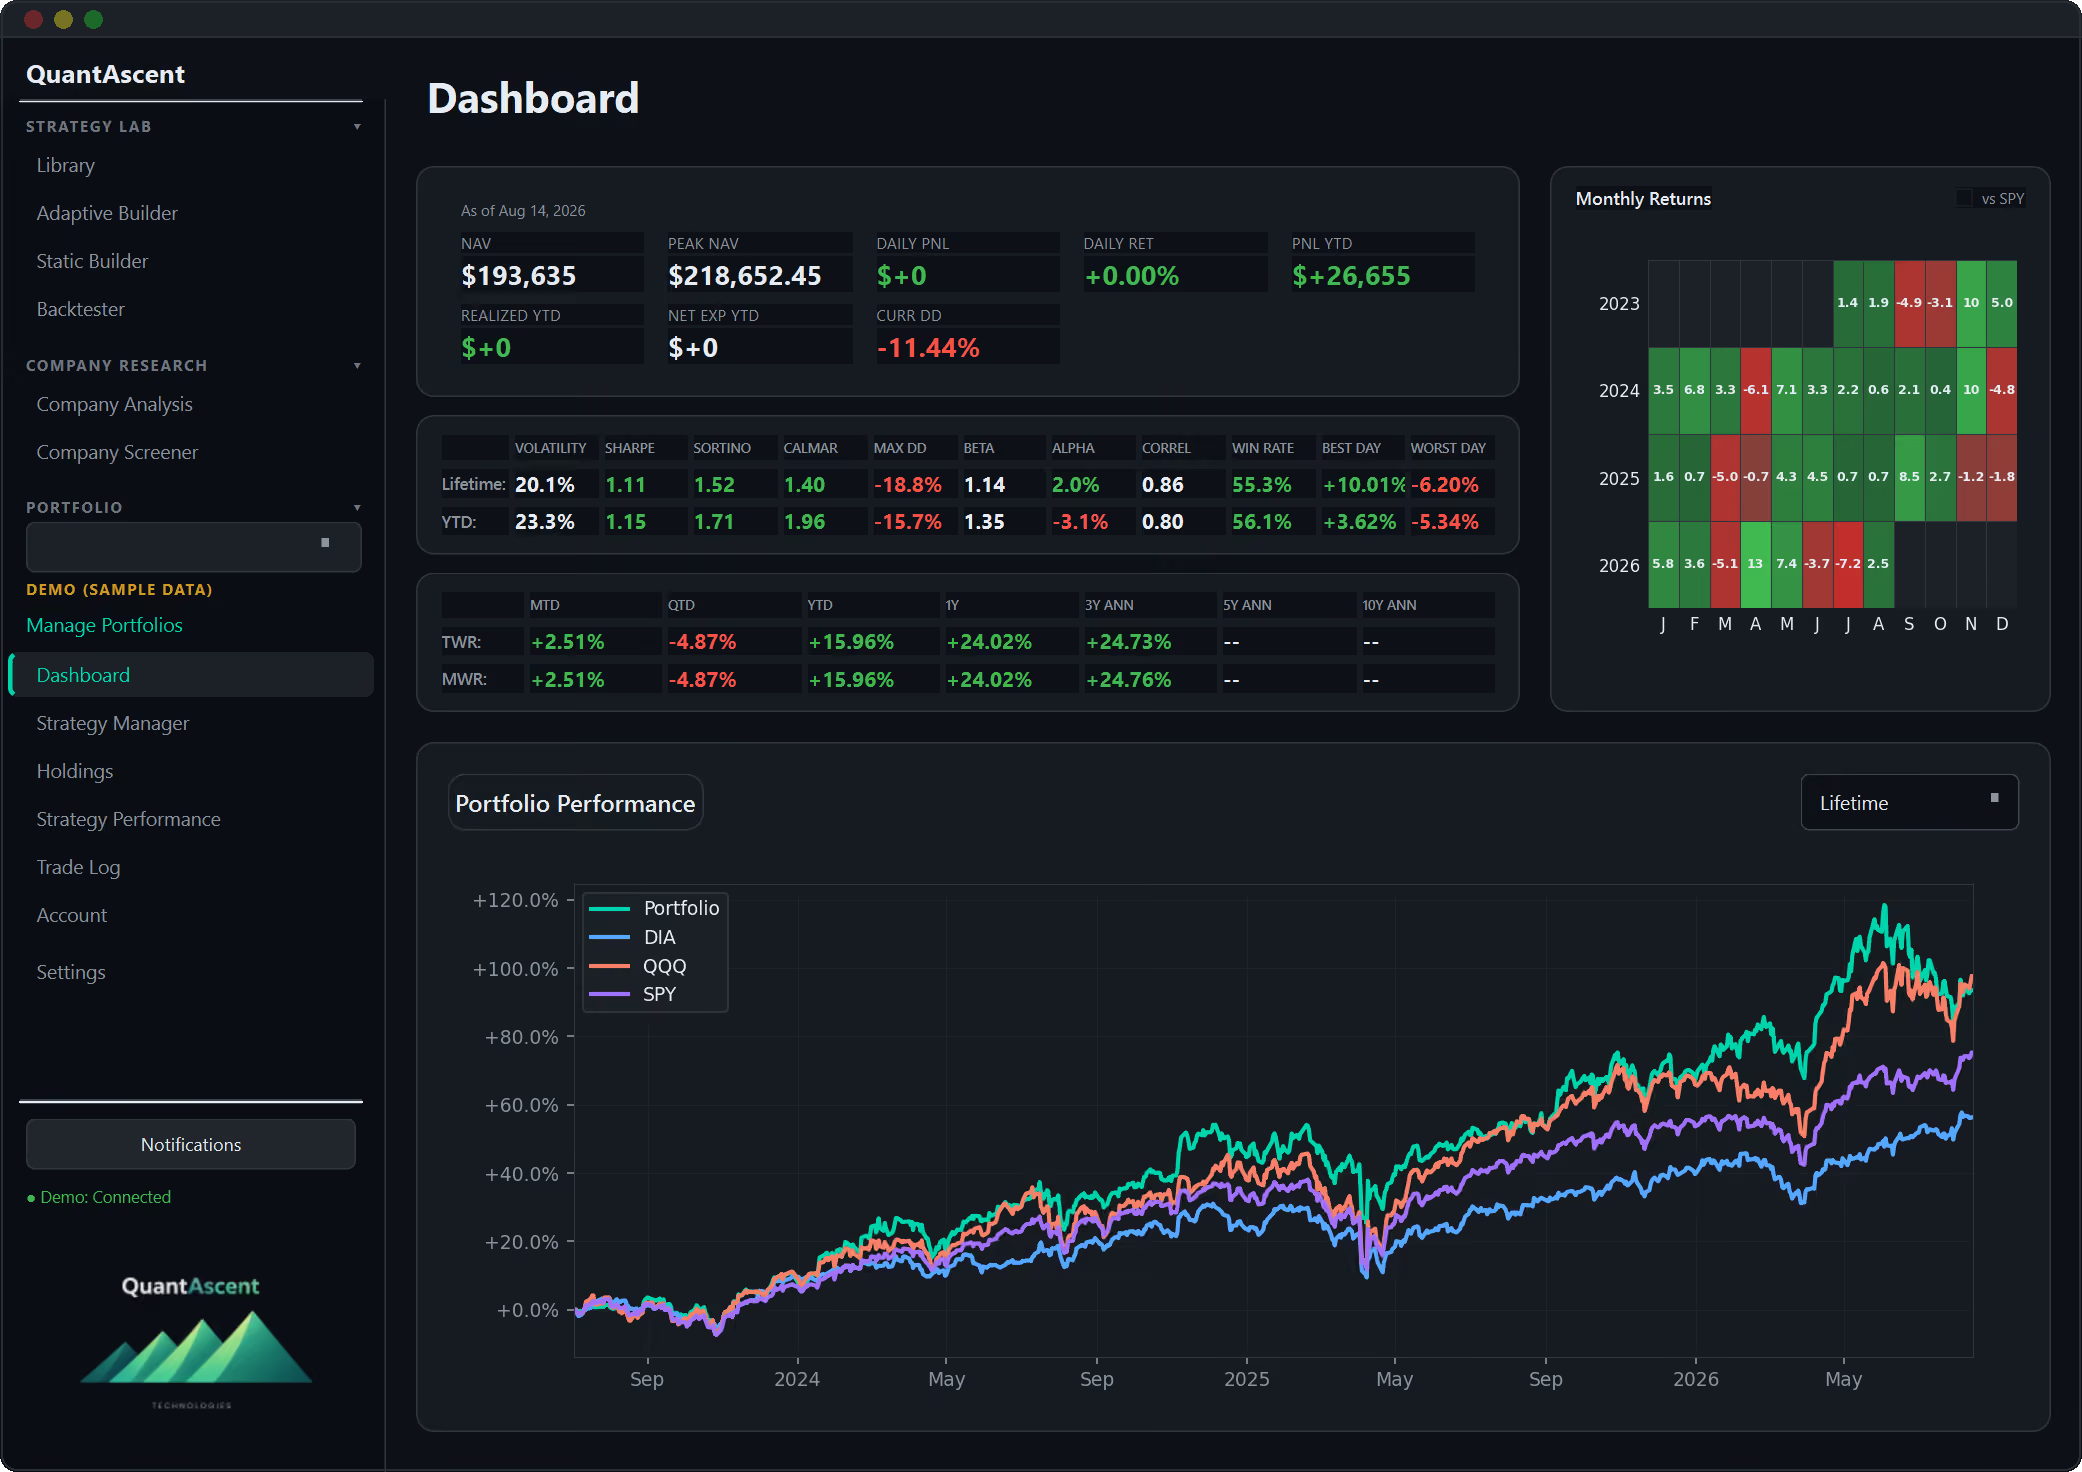
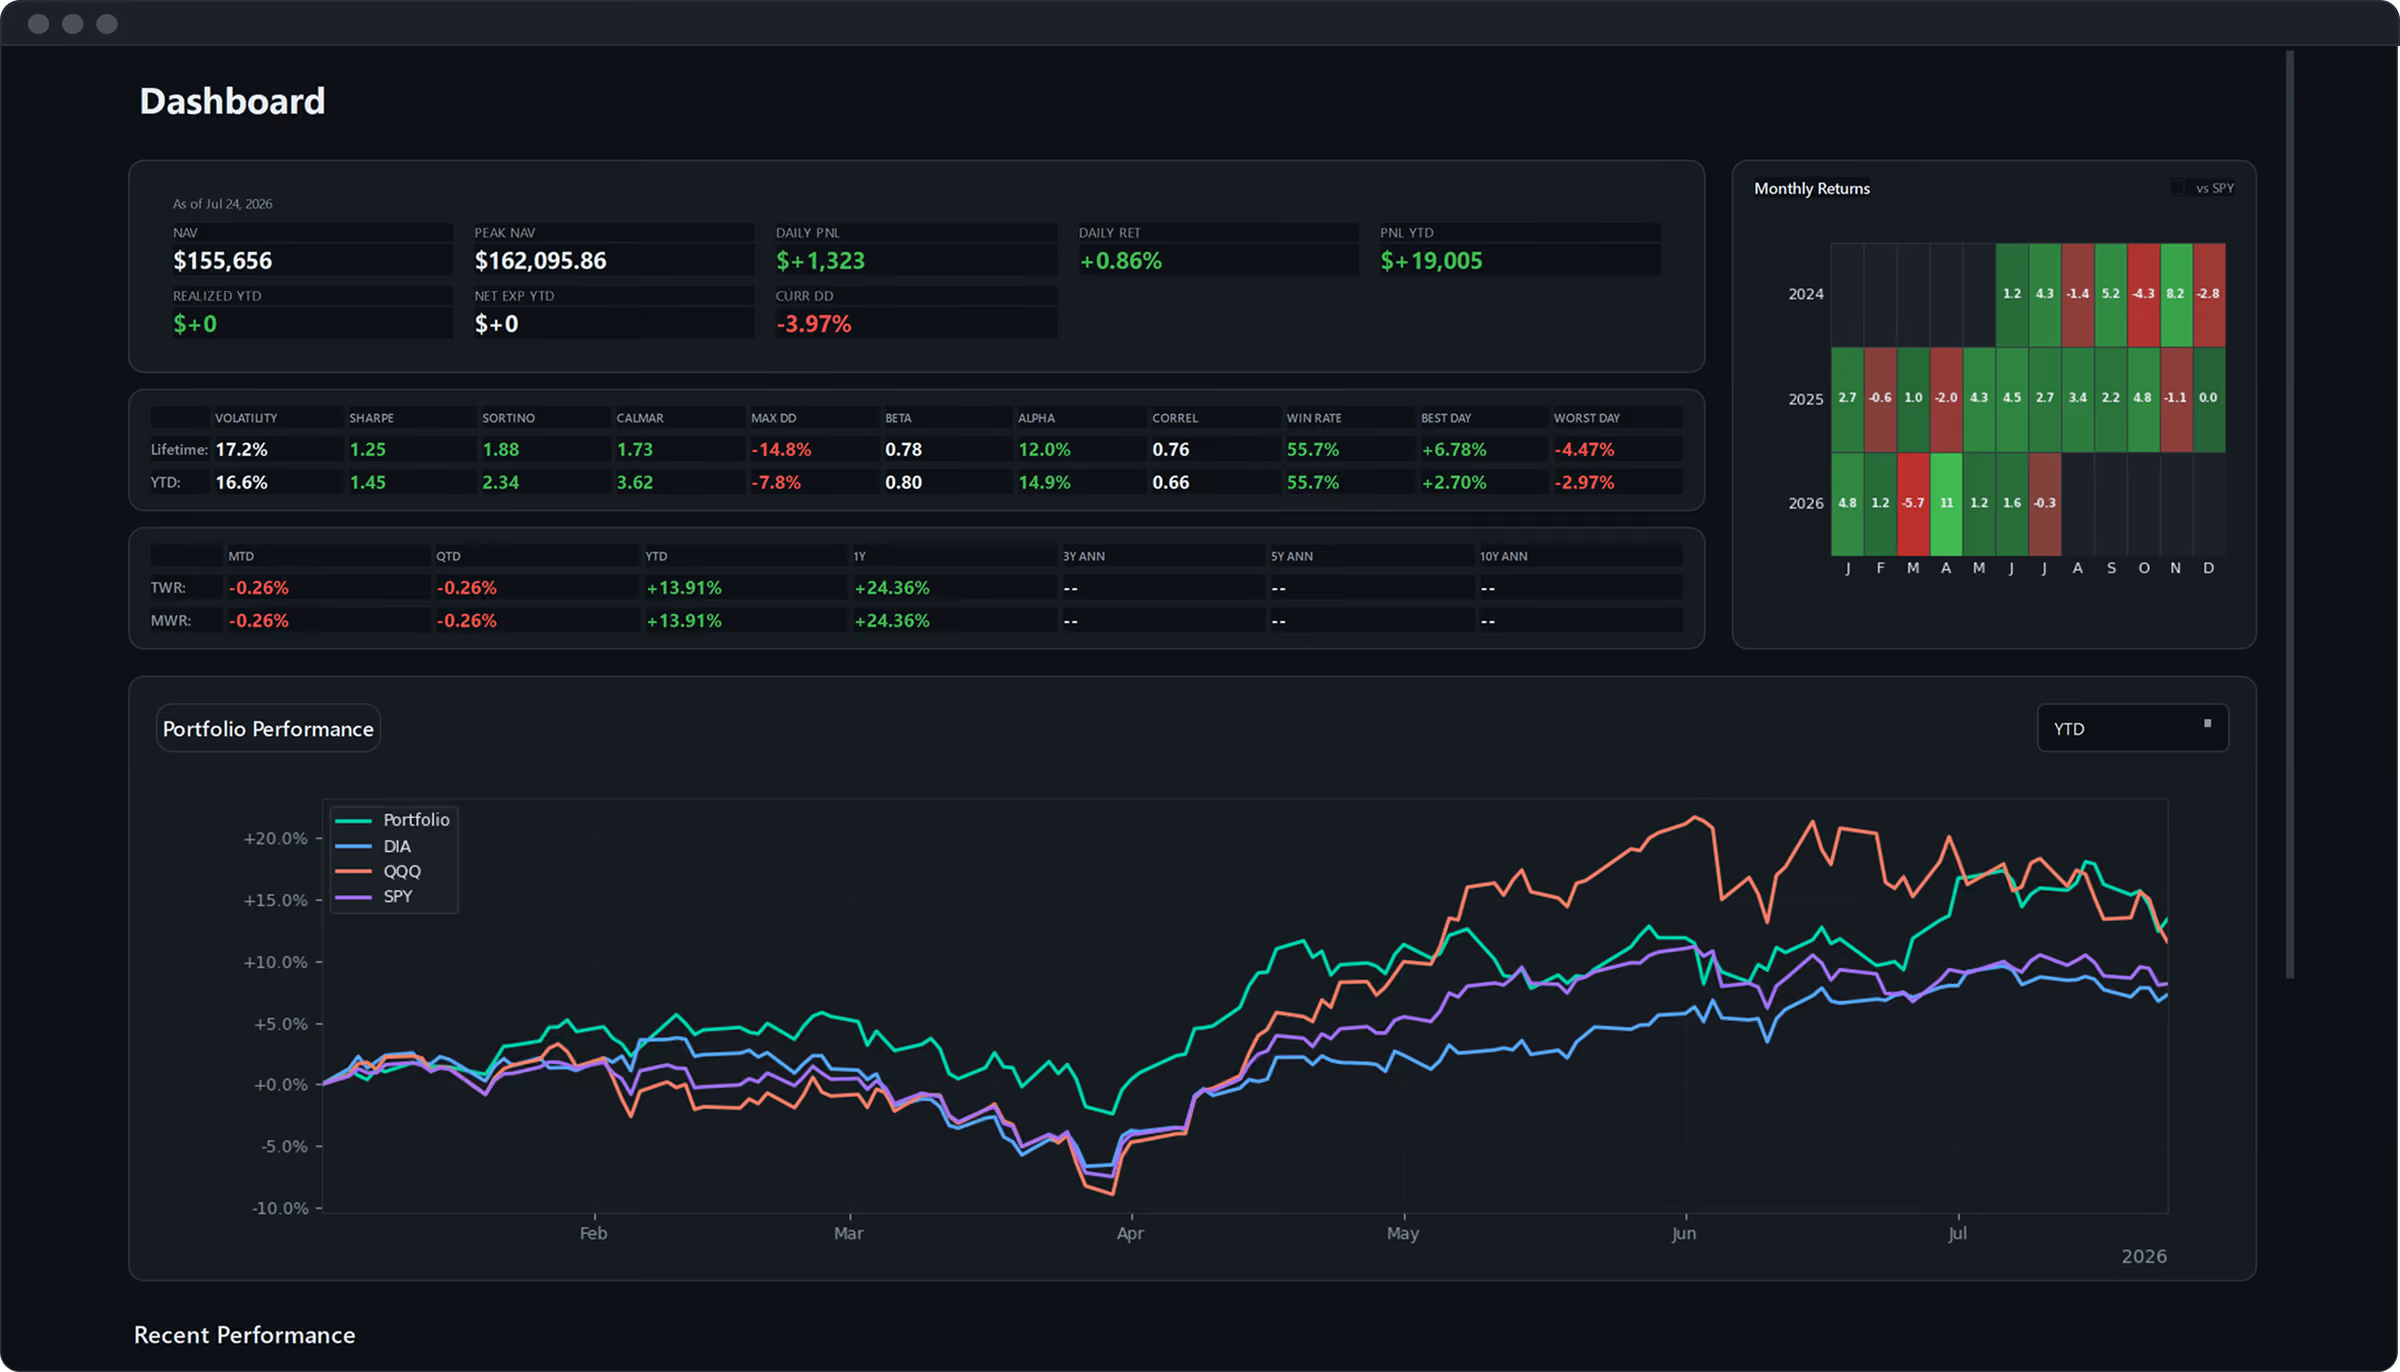
QuantAscent portfolio dashboard showing net asset value, risk ratios, monthly returns, and portfolio performance versus SPY, QQQ, and DIA

Screenshot shows sample data for illustration. Performance is hypothetical, not actual trading results, and not a guarantee or prediction of future performance.

QuantAscent ✦ Fall 2026 QuantAscent ✦ Fall 2026 QuantAscent ✦ Fall 2026 QuantAscent ✦ Fall 2026 QuantAscent ✦ Fall 2026 QuantAscent ✦ Fall 2026

A new kind of investing tool. Built for people who want to understand their strategies — not guess.

One signal is fragile. Several signals have historically reduced that fragility.

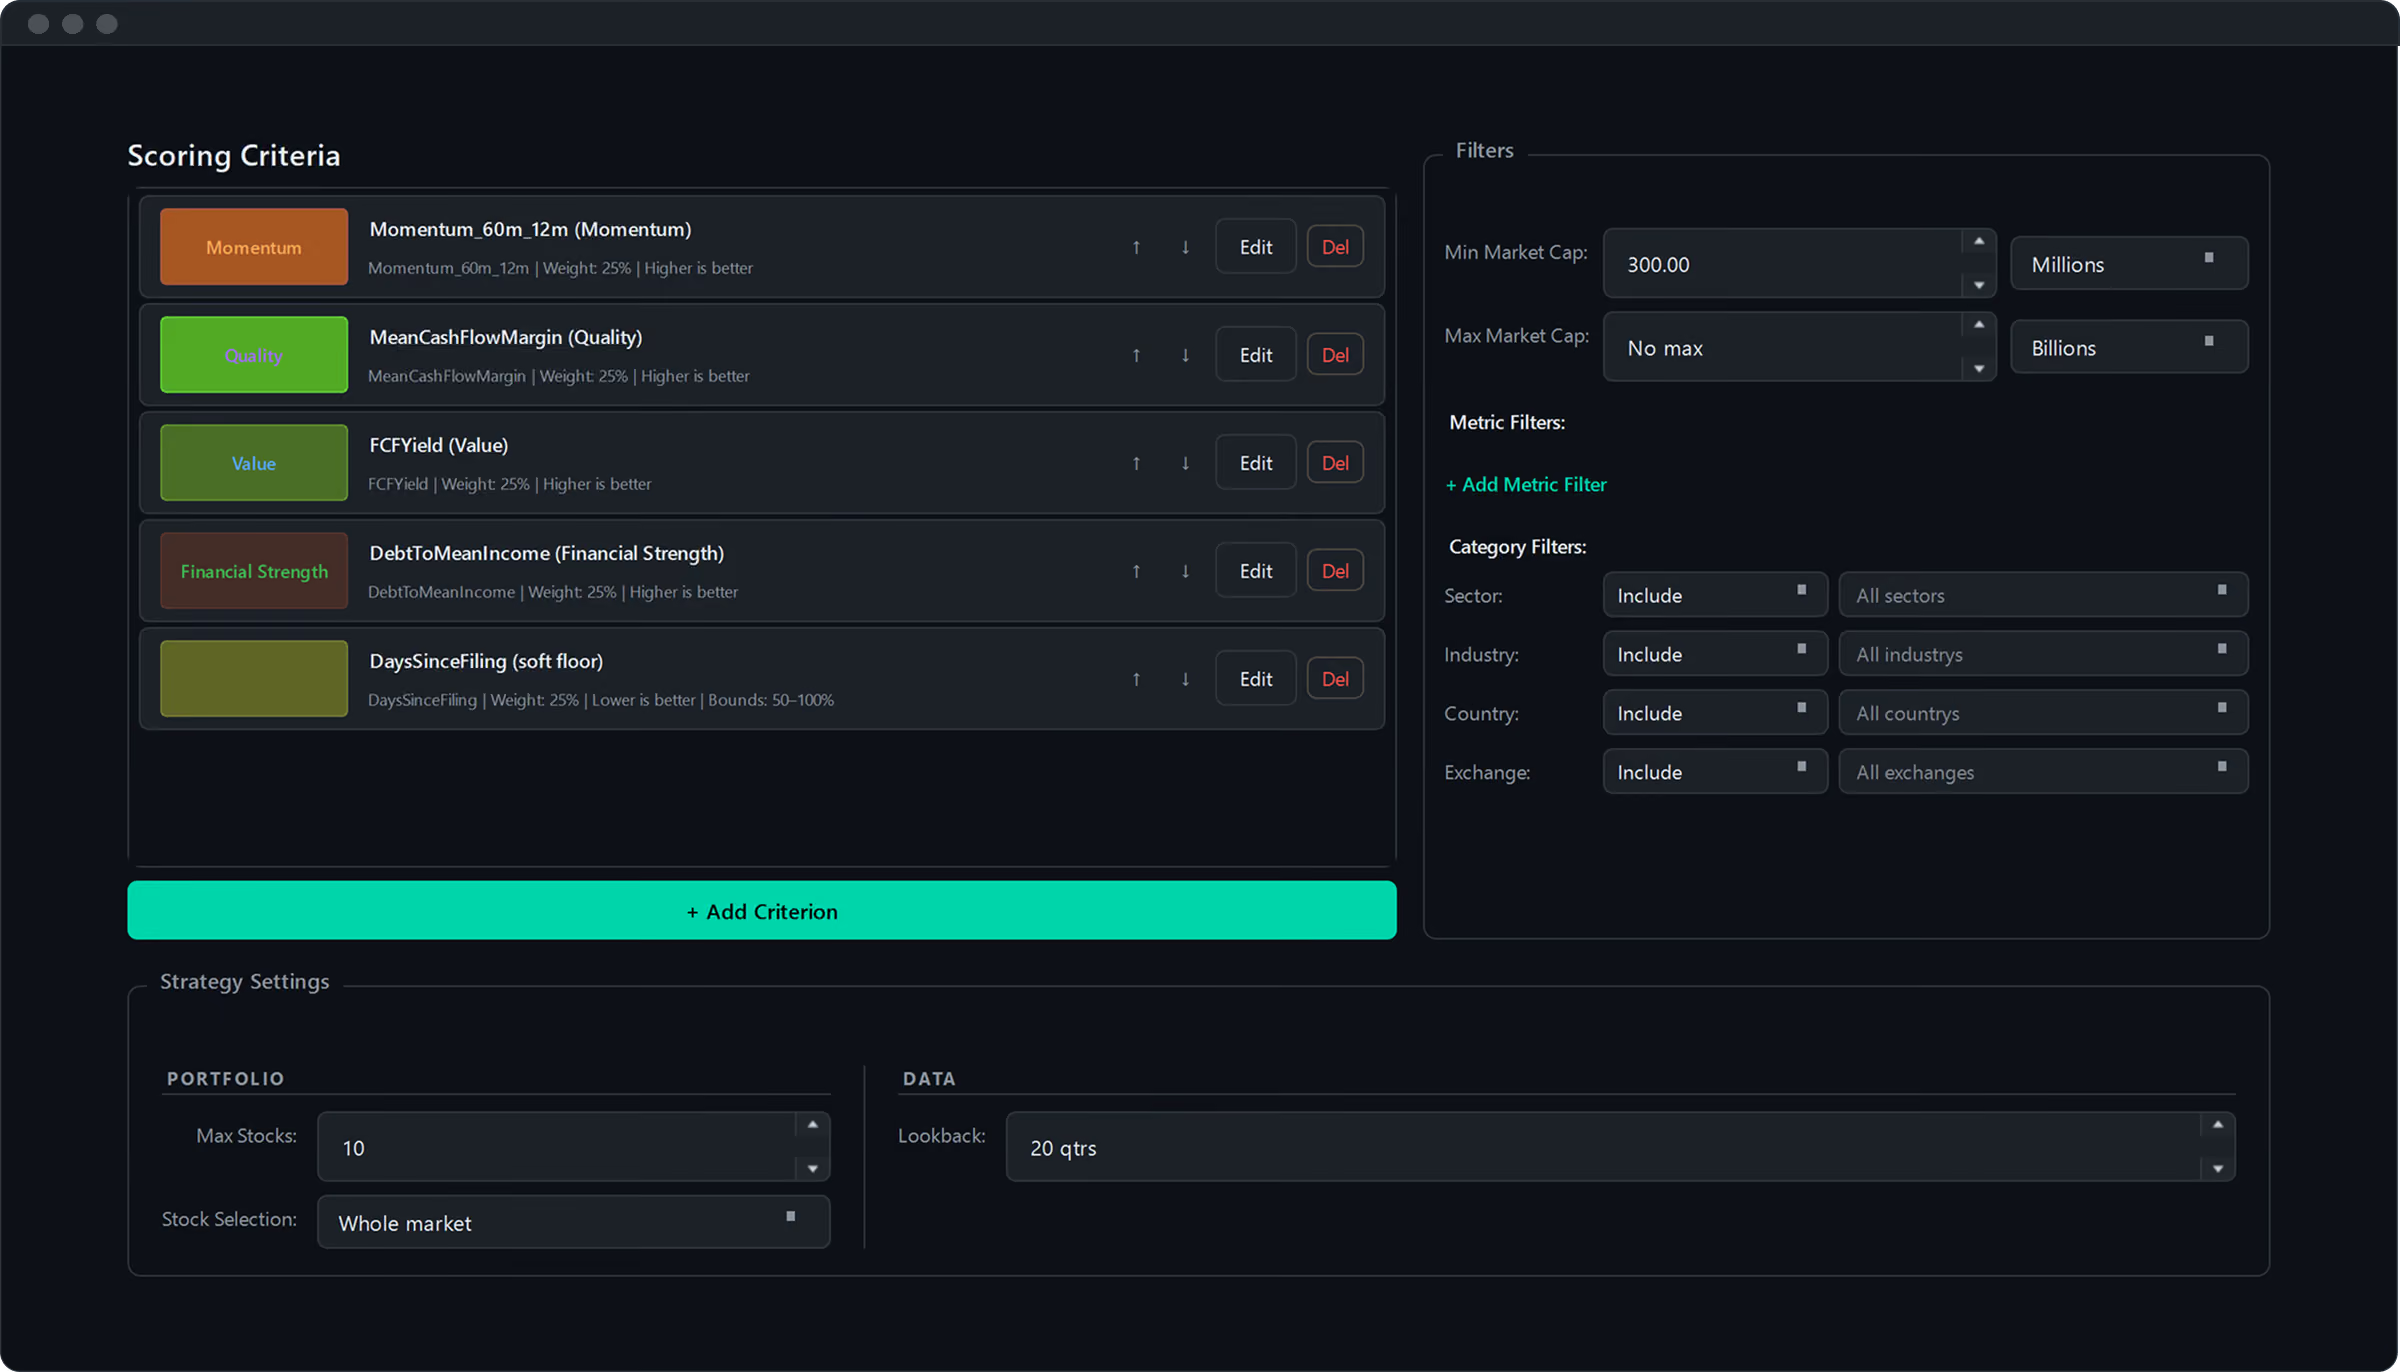
No single factor — momentum, value, quality — works consistently on its own. Each factor has periods where it breaks down. Combining them into a multi-factor system has historically smoothed those swings, giving you a steadier process to follow.

MULTI-FACTOR SCORING EXAMPLE
FCF YIELD
MOMENTUM
ROIC
LOW DEBT
STRONG SIGNAL
FAIR SIGNAL
STRONG SIGNAL
SUPPORTING
COMBINED INTO ONE SCORE
MULTI-FACTOR SCORE — STRONG

Each factor is weighted and combined into a single composite score. The top-ranked stocks are then displayed in the results.

TRY IT NOW

Add a factor. See what changes.

Build multi-factor strategies in real-time.

STEP 1 OF 3 Define your stock universe

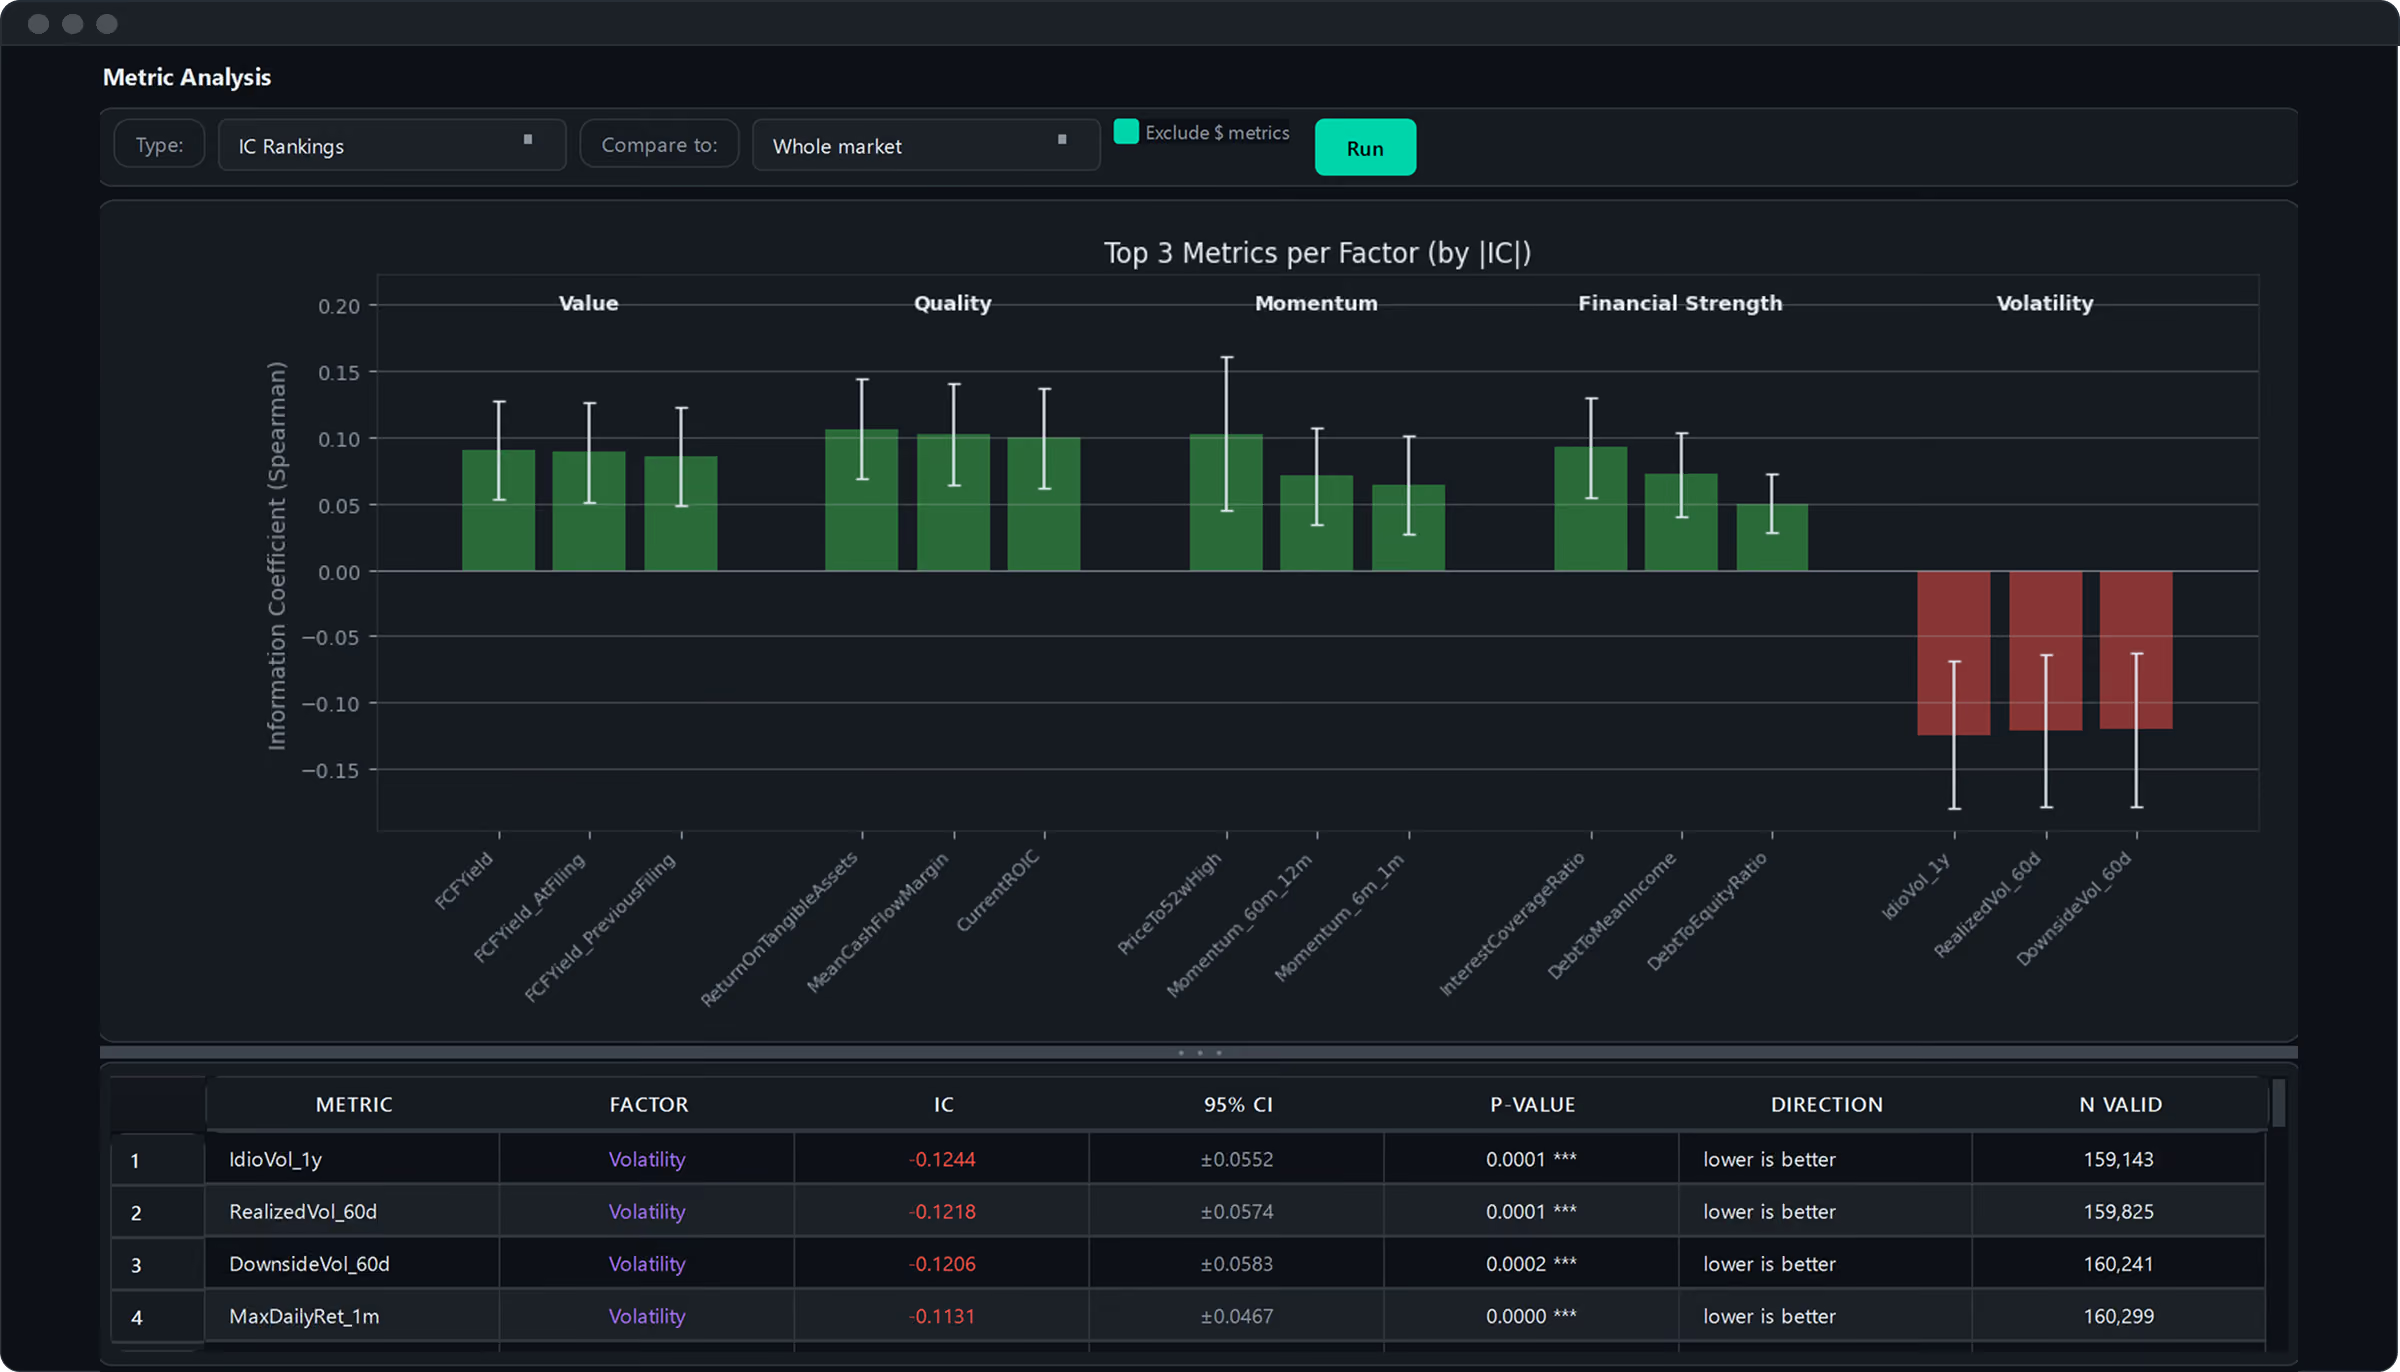
Filter the market down to the stocks your strategy will score and trade — then find the metrics that have been most associated with subsequent returns inside it.

SECTOR
Utilities
Technology
Healthcare
Industrials
Energy
MARKET CAP
Any
≥ $300M
≥ $2B
≥ $10B
SHARE PRICE
$—
to
$no max
STOCKS IN UNIVERSE 6,207
✓ Technology
✓ Market cap ≥ $300M
✓ Price ≥ $5.00
2023–2026 · 90-day rebalance · liquidity-screened
Continue
STEP 2 OF 3 IC Rankings — top metrics per factor TECHNOLOGY · 947 STOCKS
INFORMATION COEFFICIENT (SPEARMAN) · 90D FORWARD RETURNS
ADDED TO STRATEGY 0/3
Continue
FCFYield [decimal %] Value
IC +0.094 ±0.011 95% CI p 0.0000 *** higher is better n_valid: 10,832
Quintile Returns — Spread (Q5−Q1): +3.7 pts

Stocks in the top quintile by FCF yield returned +2.8% per period vs −0.9% for the bottom quintile — a spread of +3.7 points.

Add to strategy
STEP 3 OF 3 Score Analysis — mean return by strategy score
The signal held in this sample

Stocks scoring 70+ outperformed the filtered universe average of +3.65% — which itself beat the unfiltered market average of +1.29%.

The dip at 80 reflects a thin sample: 4% of stocks.

Run backtest
BUILDING YOUR STRATEGY…
DONE
+108.7%over 3 years

Built from the three factors you just selected.

Strategy +108.7% SPY +36.5%
CAGR+27.8%
Sharpe1.49
Max Drawdown−14.5%
Ann. Volatility15.7%
⏸ paused — click to resume
⟳

This is an animation, not a backtest. The curve is illustrative and does not represent any strategy's results, actual or hypothetical. QuantAscent does not provide investment advice.

Every result is explainable.

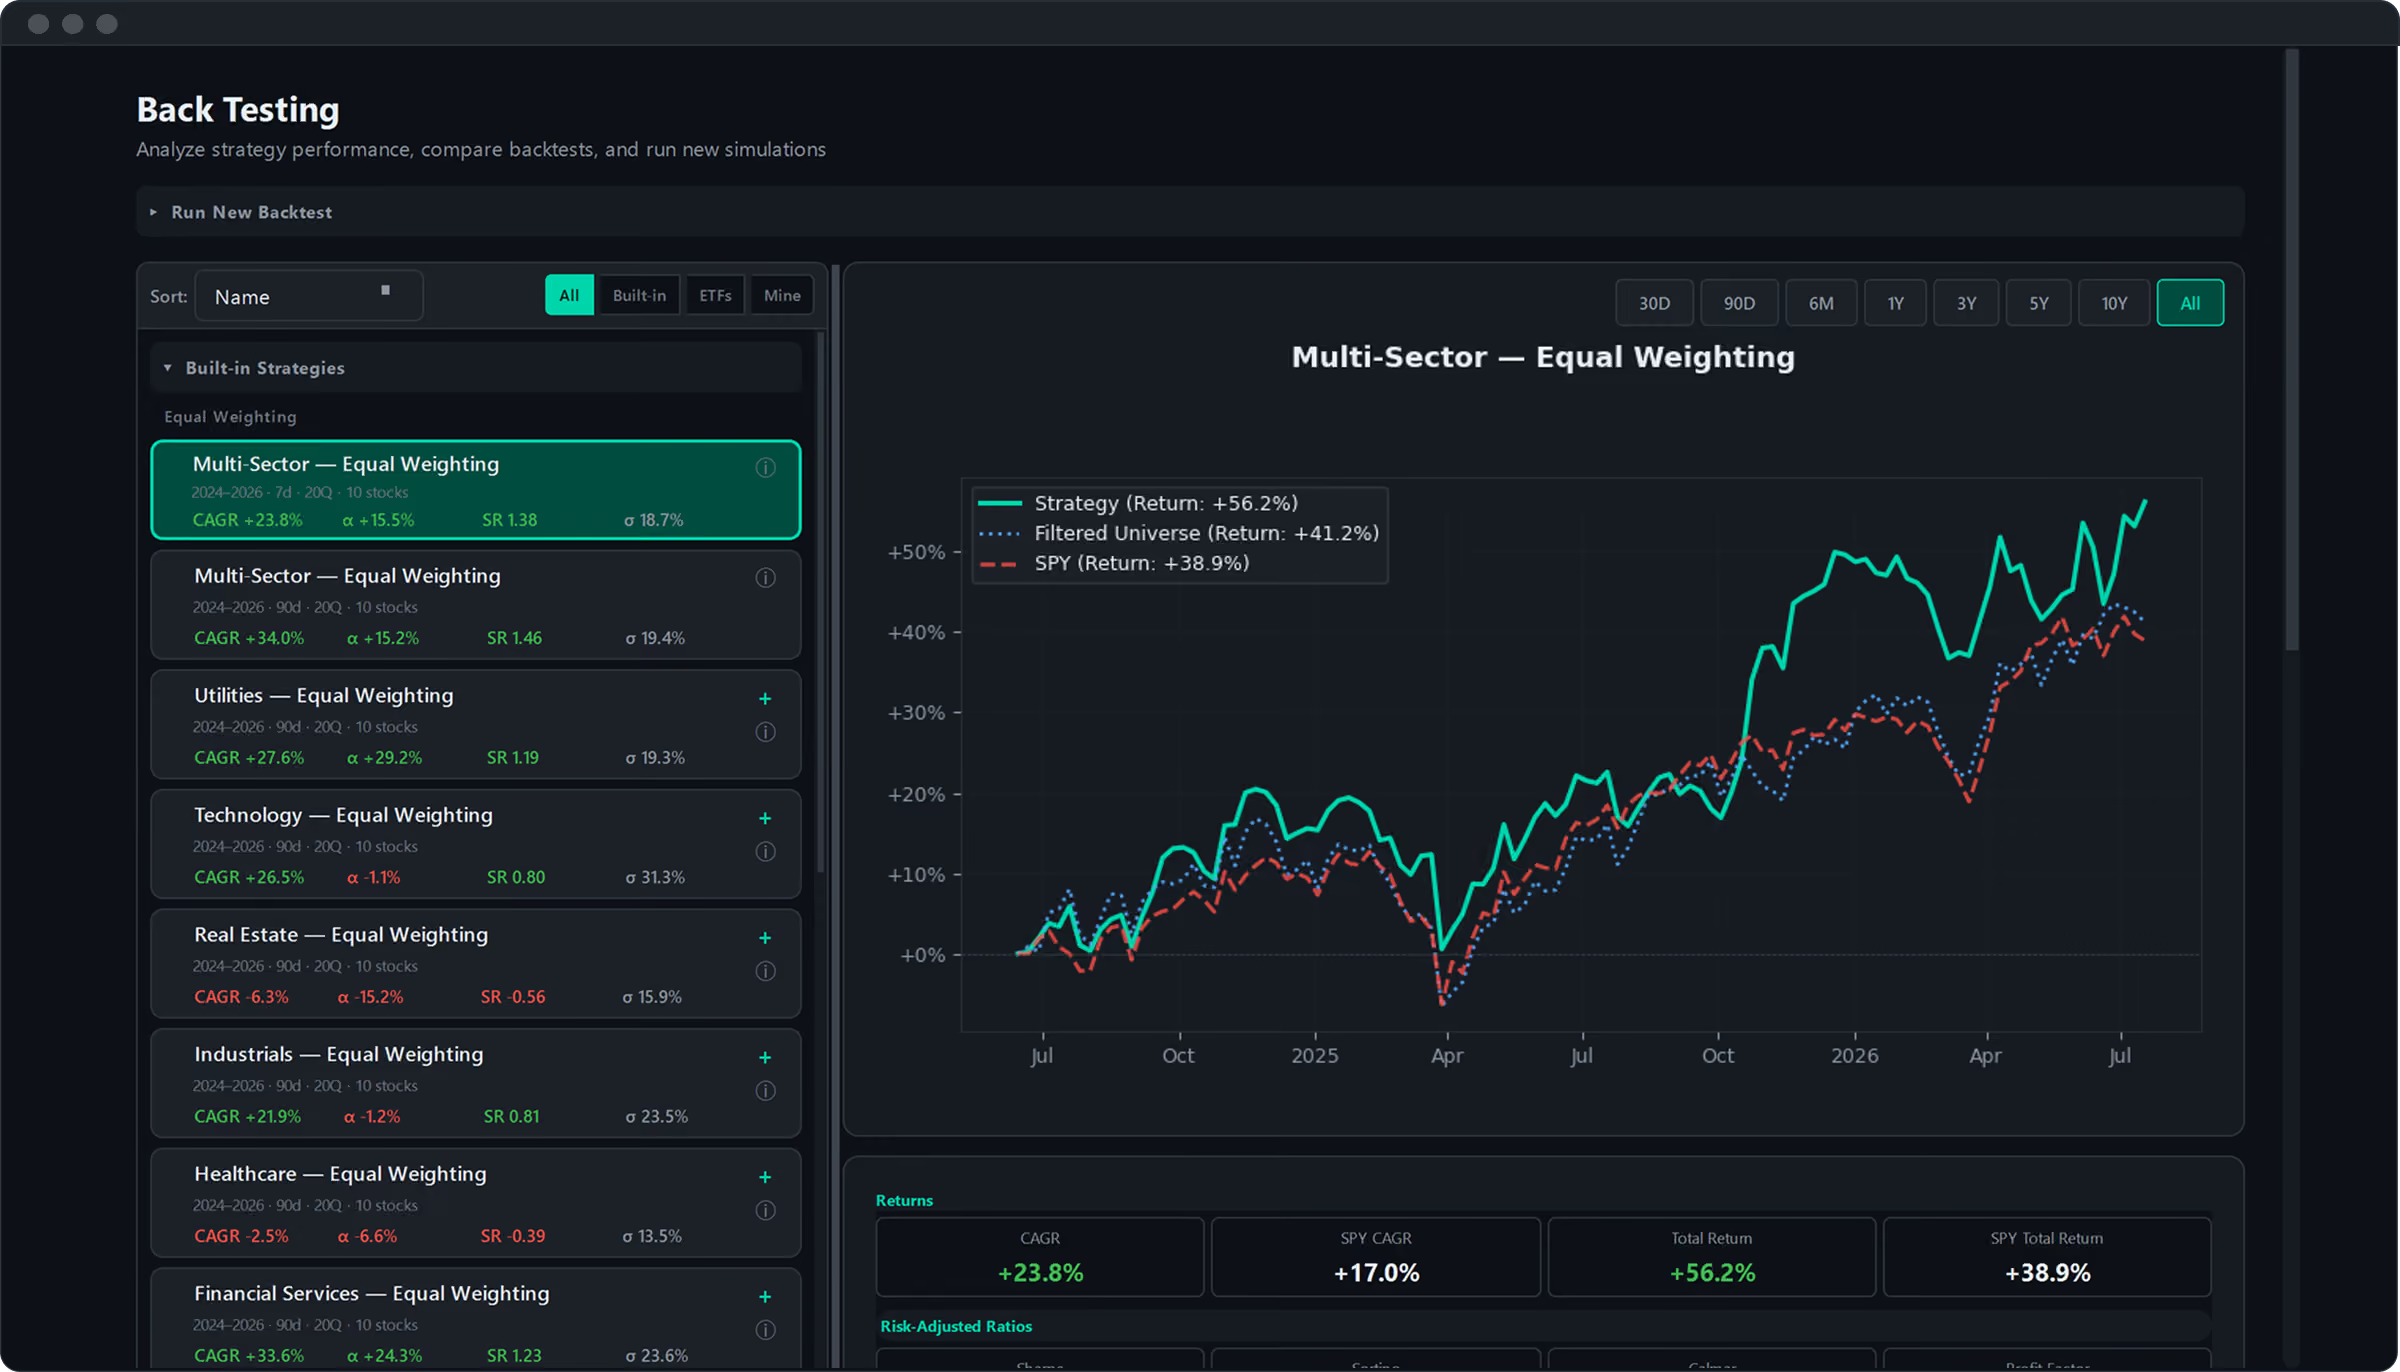
A record shows the rules that produced it, the span it ran on, and where it beat and trailed the market — not just the number at the end.

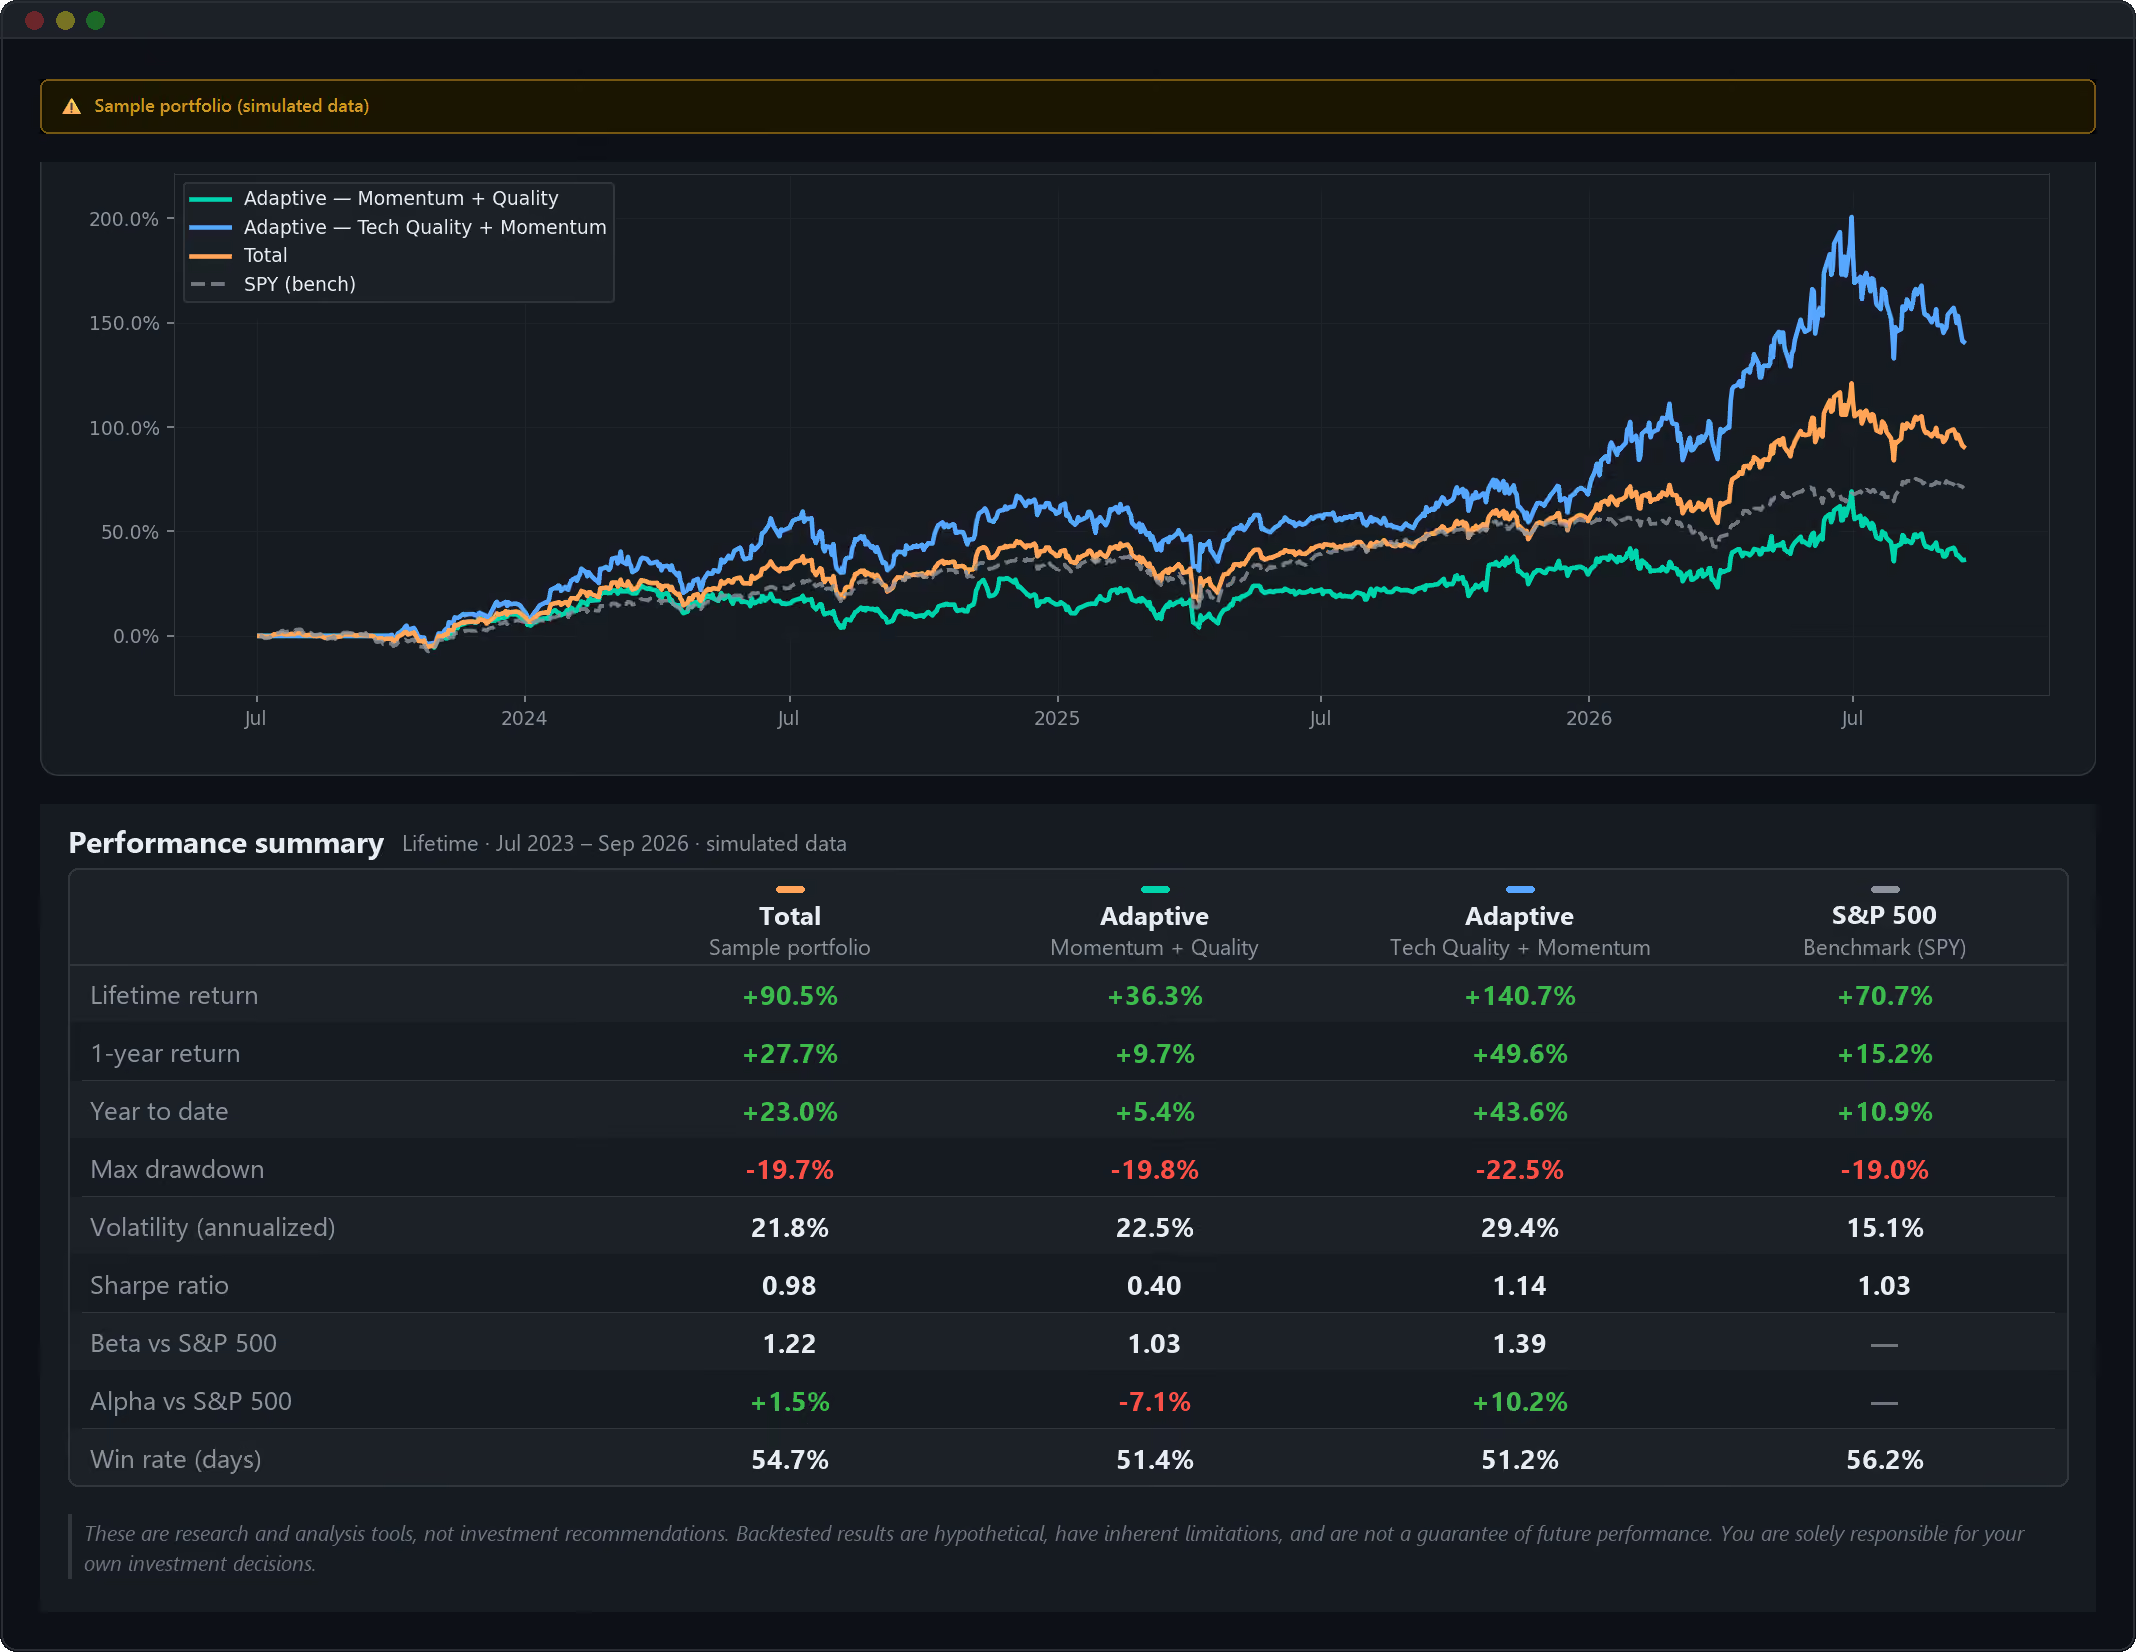
Sample portfolio with simulated data: lifetime performance of two adaptive strategies and two index trackers against the S&P 500 — hypothetical results
IN THIS CHART
Total - Sample Portfolio
Adaptive - Momentum + Quality
Adaptive - Tech Quality + Momentum
S&P 500 - Benchmark
WHAT THIS SHOWS

Total — Sample Portfolio holds all four sleeves at fixed weights and finished the simulated span at +90.5%, versus +70.7% for the S&P 500, with a Sharpe of 0.98 and 21.8% annualized volatility.

It fell 19.7% peak to trough in April 2025, almost exactly as far as the index did, and it carried more market exposure than the index (beta 1.22).

Every metric is calculated from the same historical data, same time window, same assumptions — so the comparison is apples to apples.

WHAT THIS SHOWS

Adaptive — Momentum + Quality draws ten stocks from the whole market and re-derives its picks every quarter. Over this span it returned +36.3% and trailed the S&P 500's +70.7%, with a Sharpe of 0.40.

Its worst stretch came late: a 19.8% drawdown in the summer of 2026. It sits in the sample portfolio for exactly that reason — a process can be sound and still lose to the index for three years, and the record shows it.

Every metric is calculated from the same historical data, same time window, same assumptions — so the comparison is apples to apples.

WHAT THIS SHOWS

Adaptive — Tech Quality + Momentum holds eight Technology stocks and posted the highest return of the four: +140.7% over the span, with a Sharpe of 1.14.

The ride wasn't free — 29.4% annualized volatility, a 22.5% drawdown in mid-2026, and a beta of 1.39, so it swings well past the market in both directions.

Every metric is calculated from the same historical data, same time window, same assumptions — so the comparison is apples to apples.

WHAT THIS SHOWS

S&P 500 - Benchmark is the benchmark every sleeve is measured against: +70.7% over the same span, a 19.0% drawdown in April 2025, and 15.1% annualized volatility.

Two of the four sleeves beat it and one didn't. All four numbers come from the same simulated portfolio, the same dates, and the same assumptions.

Every metric is calculated from the same historical data, same time window, same assumptions — so the comparison is apples to apples.

This is the sample portfolio that ships with the app. Build your own and every result gets the same treatment: the rules behind each number are one click away, and each record shows where it trailed the market, not just where it won.

Simulated portfolio. The replay models no commissions or slippage and allows fractional shares; sleeve weights were set by QuantAscent; eight candidate processes were considered, two are shown, and one was chosen by preference over a higher-ranked candidate. About the backtested results on this page. These figures are hypothetical. They were produced by applying a set of rules to historical data, not by trading an account. Backtested performance is calculated with the benefit of hindsight, assumes the rules were applied consistently and that every trade filled as modeled, and does not reflect the taxes, fees, spreads, or market conditions you would actually face. Historical data can carry survivorship and reporting biases. No representation is made that any strategy or account will achieve similar results. Past performance and hypothetical performance are not indicative of future results. Investing involves risk, including the loss of principal.

Built for investors who want to understand their edge.

Not a signal service. Not a blackbox. A tool for building and testing strategies you can actually explain.

HANDS-OFF INVESTORS

You want investing to take an hour a month — not a second job.

Set your rules once, rebalance on your schedule, and skip the news feeds and watchlists in between.

Not for: people who enjoy reacting to the market every day.

PROCESS-DRIVEN INVESTORS

You think in rules and evidence — not hunches.

Build a strategy from factors you choose, backtest it against history, and test whether your idea held up historically before you risk a dollar on it. A backtest is evidence, not proof.

Not for: anyone who'd rather trade on gut feel than test an idea.

WHOLE-PORTFOLIO INVESTORS

Your ETF core, your strategy sleeves, your individual picks — one account view, every piece benchmarked.

Strategies are part of your portfolio, not a separate app.

Not for: anyone who wants every bank account, credit card, and property in one net-worth dashboard — QuantAscent manages your brokerage portfolio.

TRANSPARENCY-FIRST

You want to know exactly why your portfolio holds what it holds

Every position traces back to a factor score. Every rebalance follows a rule you set. You own the logic, not just the outcome.

Not for: anyone comfortable handing their decisions to a black box they can't inspect.

GETTING STARTED

Not sure where to start?

GET STARTED

Create your first multi-factor strategy today.

You can build your first strategy in about 30 minutes. Cancel anytime.

Create your free account today, no card needed. When the software releases, come back and sign in to start your 60-day free trial (card required), then $19/mo unless you cancel. Sign up before November 12 and get 50% off your first year.

QuantAscent Technologies LLC is a software company. It is not a registered investment adviser, broker-dealer, or financial planner, and nothing on this site or in the application is investment, financial, legal, or tax advice, or a recommendation or solicitation to buy, sell, or hold any security. Strategies, screens, and backtests are analytical tools that you select, configure, and act on; they are not tailored to your financial situation, objectives, or risk tolerance. Performance figures shown on this site are hypothetical and backtested unless expressly labeled otherwise; they are not actual trading results and are not a guarantee or prediction of future performance. Investing involves risk, including the possible loss of principal. See our Disclosures, Terms of Service, and Privacy Policy.